[ XD ] CASE STUDY · ILLUSTRATION
X-Data
Big data, drawn in black and white.
X-Data offers big data and analysis solutions across industries. They needed their process explained visually: abstract, black and white, and clear of text-heavy formats.

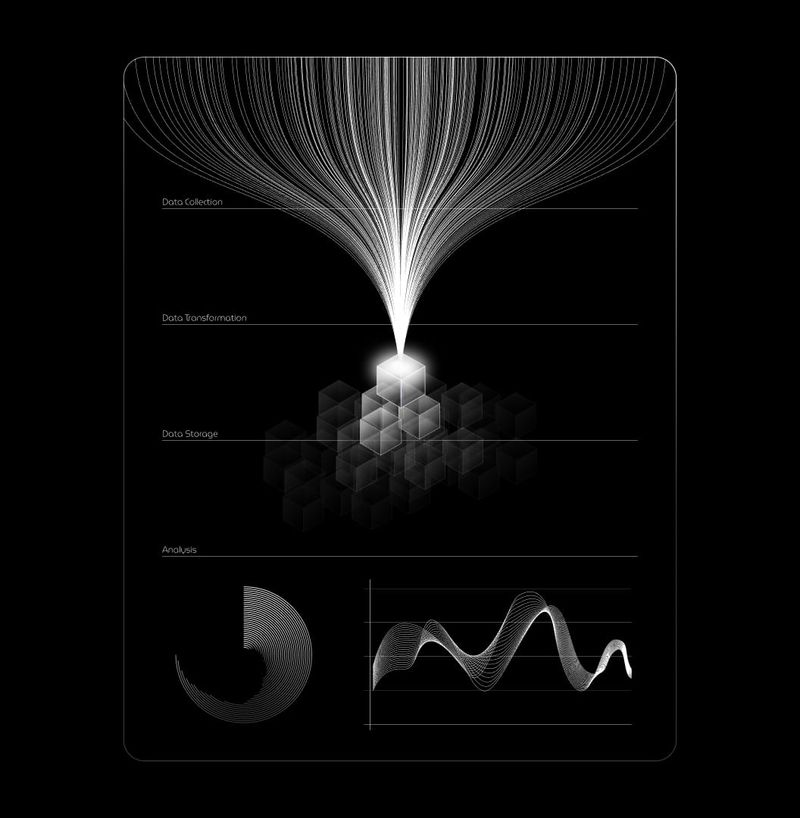
01 THE PIPELINE, VISUALIZED
An infographic turns the abstract into the physical: data pours in, condenses, and lands as insight. Collection, transformation, and storage in one continuous fall of light.
02 THE CITY OF DATA
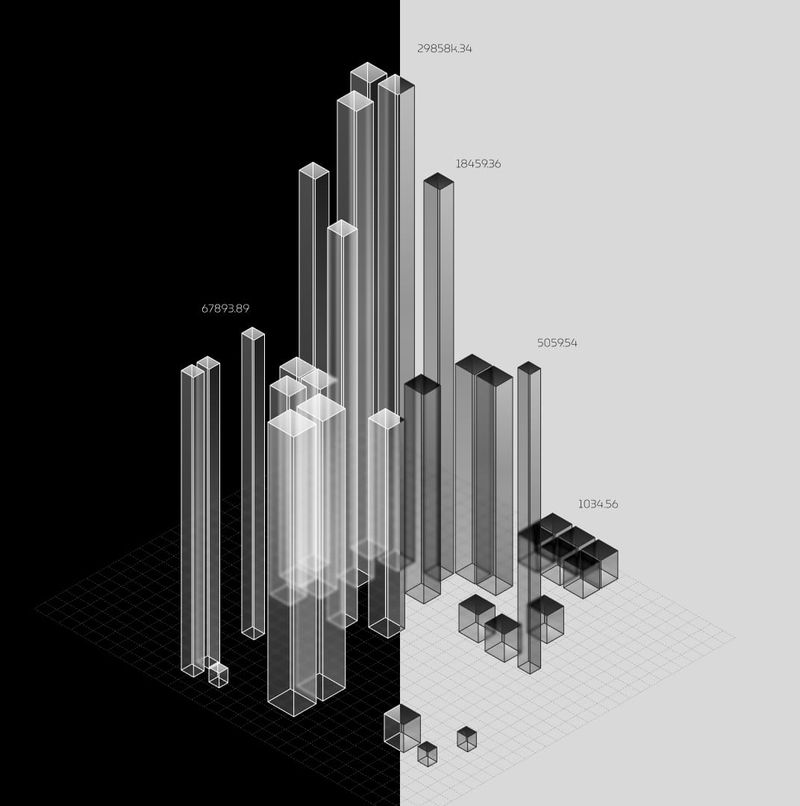
Datasets became an isometric city: towers of information rising from the grid, each district a stage of the analysis. Abstract enough to stay timeless, concrete enough to explain itself.
03 CONCEPT TO FINAL
Every piece walked the same road: concept, pencil sketch, final render, keeping the set coherent in both dark and light mode without losing the established style.